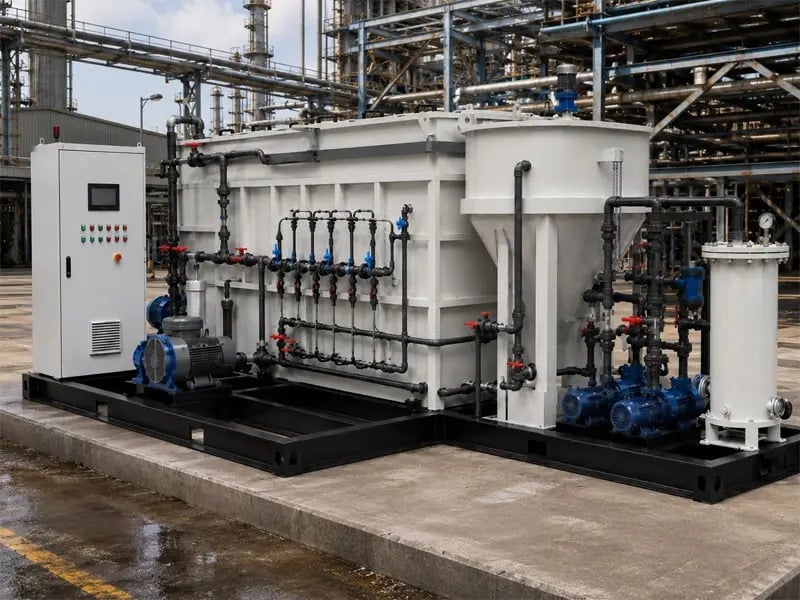
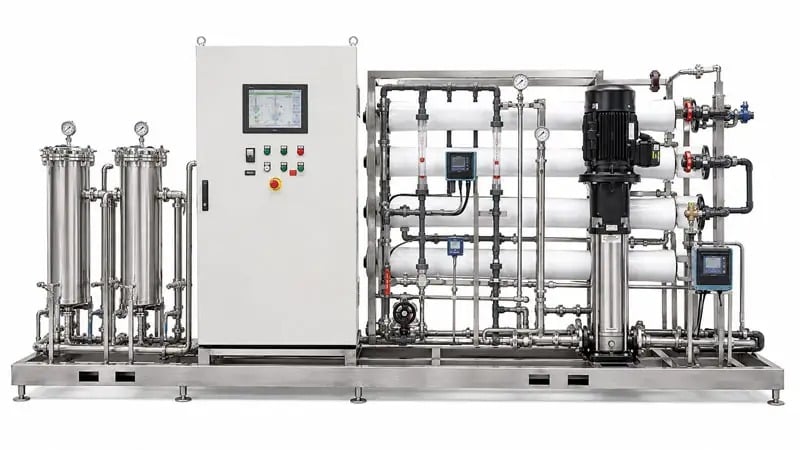
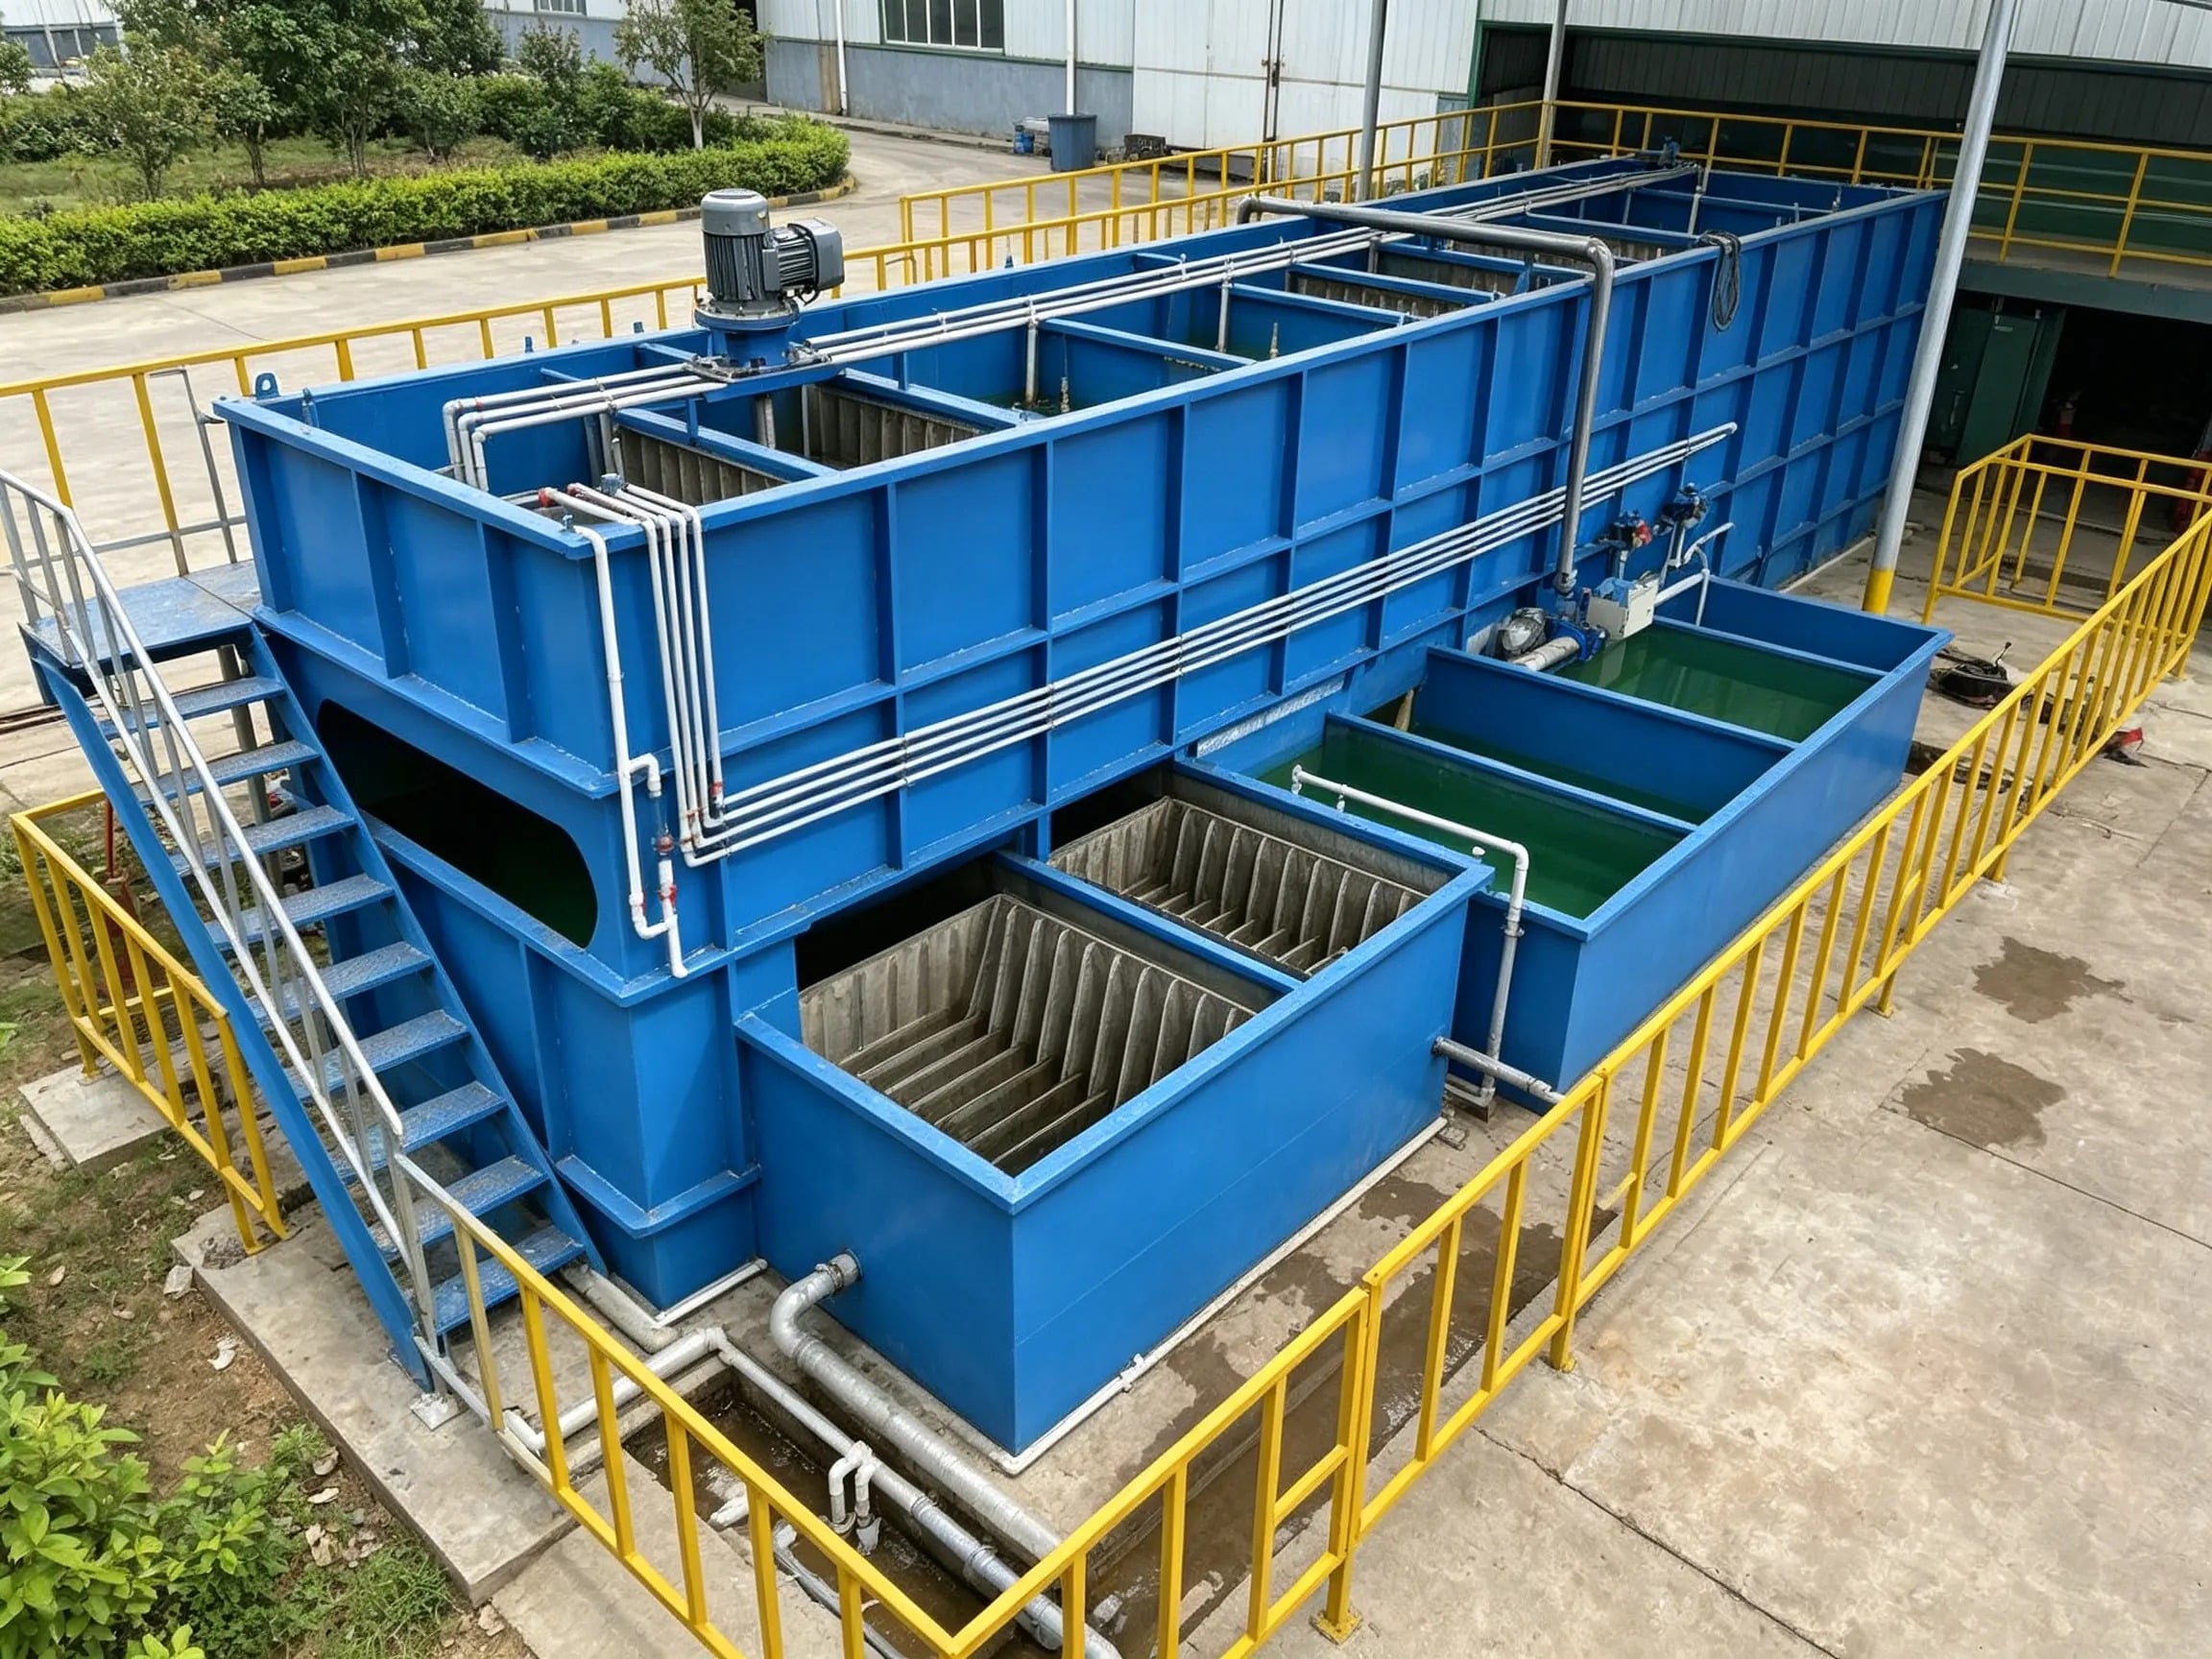
Understanding the true cost of membrane replacement within an industrial water recycling system requires more than simply looking at purchase price. Membrane technologies are critical to treating and reclaiming water for reuse, but their cost implications span far beyond the initial hardware investment. Organizations must evaluate maintenance cycles, downtime costs, chemical consumption, and replacement frequency to make informed decisions about which membrane technology delivers the best value.
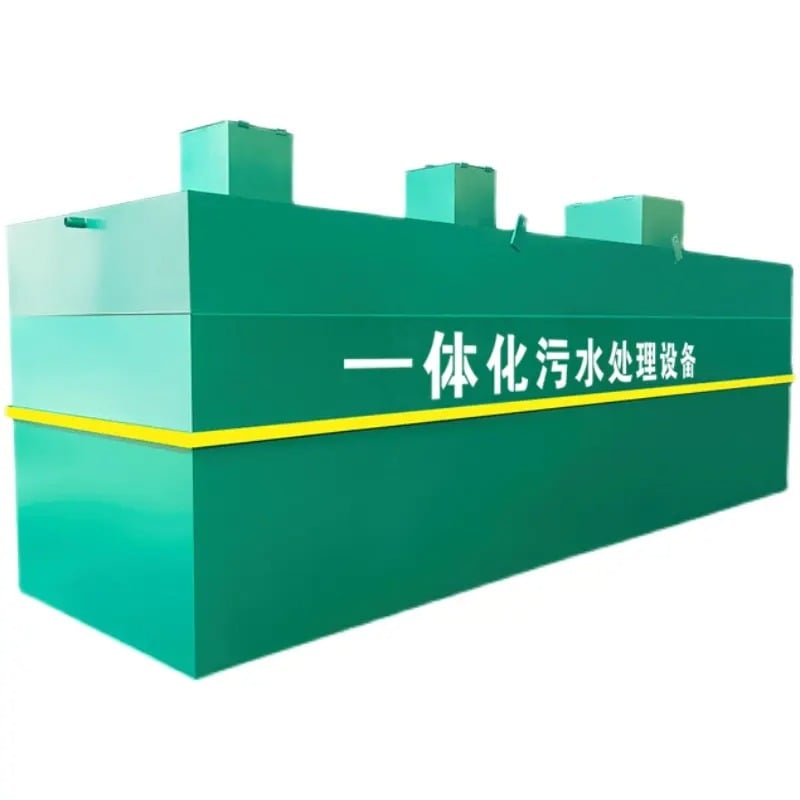
The decision between reverse osmosis (RO), ultrafiltration (UF), and other membrane types directly shapes your operational budget and long-term profitability. This guide walks through the key factors that drive membrane replacement costs, how to calculate total cost of ownership (TCO) accurately, and the practical trade-offs between different membrane solutions for your specific industrial application.
Understanding Membrane Technology and Replacement Drivers
How Membranes Degrade Over Time
Membranes in industrial water recycling systems degrade through multiple mechanisms. Fouling—the accumulation of particles, biological growth, and chemical deposits on membrane surfaces—is the primary cause of performance decline. RO membranes, which operate at higher pressures and produce ultra-pure permeate, are particularly susceptible to fouling from colloidal materials, bacteria, and scaling. UF membranes handle larger particles but still face biofilm formation and chemical attack from oxidants or pH extremes.
Membrane lifespan typically ranges from 3 to 7 years depending on feed water quality, pretreatment effectiveness, and chemical cleaning frequency. As membranes foul, they require more aggressive cleaning protocols—including chemical backflushing, caustic soaks, and acid treatments—that accelerate material degradation.
Factors Affecting Membrane Life Expectancy
Several operational factors directly influence how long membranes survive before replacement. Influent water quality is paramount; systems treating highly contaminated industrial wastewater require more aggressive pretreatment than those recycling process cooling water. Temperature extremes accelerate membrane degradation, particularly for aromatic polyamide RO membranes, which become more fragile at elevated temperatures.
The frequency and intensity of chemical cleaning also impacts replacement timing. Over-aggressive cleaning can damage membranes prematurely, while insufficient cleaning leads to rapid fouling and shortened service life. Pretreatment investments—such as multimedia filtration, activated carbon, or UV disinfection ahead of your industrial water recycling system—significantly extend membrane life by removing particles and biological contaminants before they reach the membrane surface.
Calculating Total Cost of Ownership for Membrane Replacement
Direct and Indirect Costs in TCO Analysis
True TCO for membrane replacement encompasses far more than the membrane purchase price. Direct costs include the membrane elements, frame assemblies, gaskets, and installation labor. However, indirect costs often exceed hardware expenses: chemicals for backflush and cleaning, disposal of cleaning waste, lost production time during replacement procedures, and temporary treatment capacity loss.
Energy consumption tied to membrane pressure drop is another often-overlooked TCO component. As membranes foul, transmembrane pressure increases to maintain target flow rates, consuming more electricity. Over a membrane's lifetime, this rising energy cost can represent 15–30% of total membrane-related expense. Some facilities implement pressure monitoring and proactive cleaning schedules to manage this escalation.
Building a Comparative TCO Model
Develop a TCO spreadsheet that tracks costs over a 5 to 10-year horizon, the typical service life of an industrial water recycling system. Enter expected replacement frequency based on your feed water quality and operating parameters. Segment costs into replacement intervals: year 1–2 (initial membranes, no replacement), year 3–4 (first major replacement), year 5–6 (second replacement if needed), and beyond.
Calculate a cost per gallon treated by dividing total 5 to 10-year expenses by the cumulative gallons produced. This metric enables direct comparison between RO and UF systems or between different pretreatment strategies. Sensitivity analysis is crucial: test scenarios where feed water quality improves (reducing fouling) or deteriorates (accelerating replacement).
RO versus UF: Cost Trade-offs and Selection Criteria
Reverse Osmosis Membrane Economics
RO membranes deliver the highest water purity—removing dissolved salts, ions, and organic compounds—but at a premium cost both in capital and operation. RO membranes for an industrial water recycling system typically cost $500–$1500 per element, depending on size and specification. However, RO systems require substantial pretreatment (multimedia filters, carbon, softening, ultrafiltration), which adds $50,000–$200,000 to capital cost.
RO membrane replacement frequency varies widely based on feedwater: for high-quality sources, you may achieve 5–7 years; for challenging industrial wastewater, replacement may occur every 2–3 years. The advantage of RO is the consistent, predictable water quality—critical for applications like boiler feed, electronics manufacturing, or pharmaceutical processes where high purity is non-negotiable.
Ultrafiltration Economics and Operational Considerations
UF membranes are significantly less expensive: $100–$400 per element depending on material and pore size. Operating pressure is 2–4 bar, reducing energy consumption to $0.05–$0.15 per 1000 gallons. For an industrial water recycling system using UF, total installed cost is often 40–50% lower than an equivalent RO system. UF membrane lifespan can extend to 7–10 years with proper pretreatment and cleaning discipline, partly because low pressure creates less mechanical stress.
The trade-off is that UF removes suspended solids and most microorganisms but passes dissolved salts and small organic molecules. Applications tolerating slightly higher dissolved solids—cooling tower makeup, irrigation, or non-critical process water—benefit from UF's lower operating cost and energy consumption. TCO comparison between RO and UF for your specific application hinges on final water quality requirements: if your process truly needs RO purity, UF delivers false economy; if modest quality suffices, UF often wins on 10-year cost.
Optimizing Membrane Lifespan and Replacement Scheduling
Pretreatment Strategies to Extend Membrane Life
Strategic pretreatment is the highest-return investment for minimizing membrane replacement frequency in an industrial water recycling system. Coagulation and multimedia filtration remove 90–99% of suspended solids before they reach the membrane, dramatically reducing fouling rates. Activated carbon removes chlorine, which oxidizes and degrades polyamide membranes, and adsorbs soluble organic compounds that contribute to scaling and biofouling. UV or ozone disinfection eliminates biological growth potential, reducing biofilm formation on membrane surfaces.
For facilities handling challenging feedwater, investing $30,000–$100,000 in robust pretreatment often yields $100,000–$300,000 in avoided membrane replacement costs over 10 years. The calculation is straightforward: if pretreatment extends membrane life from 3 years to 5 years, you eliminate one replacement cycle per decade, with its associated downtime, chemicals, and labor. Pilot testing your feedwater through a bench-scale membrane unit can quantify fouling rate and justify pretreatment investment before capital commitments.
Preventive Maintenance and Cleaning Protocols
Aggressive preventive cleaning extends membrane life and delays replacement. Monthly or quarterly chemical backflush with citric acid or mild alkali removes accumulated deposits before they bond to the membrane matrix. Annual deep cleaning—using proprietary membrane cleaning solutions formulated for your membrane type and fouling profile—restores permeability and reduces transmembrane pressure. However, over-cleaning accelerates degradation; many OEMs recommend limiting intensive chemical cleans to once or twice annually.
Monitoring tools like differential pressure sensors, feed/concentrate flow indicators, and salinity meters provide early warning of fouling progression. When pressure drop exceeds 1.5 times the clean membrane baseline, cleaning is warranted. Data-driven cleaning protocols—cleaning only when needed rather than on a fixed calendar schedule—minimize chemical use and mechanical stress while extending TCO performance. Real-time monitoring systems, integrated into modern industrial water recycling system controls, enable operators to optimize cleaning frequency and chemical selection.
FAQ
What is the average cost of membrane replacement in an industrial water recycling system?
Average membrane replacement cost ranges from $3,000–$15,000 per event for a typical industrial system, depending on membrane type, system size, and labor rates. This includes membranes, gaskets, installation, and labor. RO membranes are typically more expensive than UF. When calculating total cost of ownership, factor in downtime, chemical cleaning supplies, and disposal fees, which can double the effective replacement cost. Pretreatment quality significantly influences replacement frequency, so two identical systems may experience very different replacement costs based on feedwater conditioning.
Should I choose RO or UF for my industrial water recycling system to minimize TCO?
The choice depends on your final water quality requirements and feedwater characteristics. RO delivers superior purity but costs 2–3 times more to operate and replace. UF is more economical but suitable only for applications tolerating some dissolved salts. Conduct a 5 to 10-year TCO analysis for both technologies using your actual feedwater data and operating parameters.
How can I extend membrane life and reduce replacement frequency in my system?
Invest in upstream pretreatment—multimedia filtration, activated carbon, and UV disinfection—to remove particulates, oxidants, and biological contaminants before they reach the membrane. Implement preventive chemical cleaning schedules based on pressure monitoring rather than calendar intervals. Maintain consistent operating pressure and recovery rates within design limits; running your industrial water recycling system above design specifications accelerates membrane degradation. Regular operator training on equipment operation and cleaning protocols prevents misuse that shortens membrane life.
 EN